Waterflood Prediction and Monitoring
Prior to the waterflooding or pressure maintenance by water injection, the most common means of prediction is reservoir simulation. In fact, I have never known a waterflood project to be considered without a simulation model. I apologize at the onset, to all those die-hard classic approach followers, but I really think that recovery by Stiles or Dykstra-Parson's method is a matter of history.
As for streamline simulation, it is the tool, which for many years, got no respect, but continued to be improved and generate accurate forecasts. It is easier to history match through automated methods. The savvy engineer can pick the tool which will best accomplish his goals.
Classic approach- for what it's worth:
The classical approach of calculating a "ballpark" recovery
factor can be done, by first calculating the permeability variation, Dykstra
Parson's ![]() as taken off the log-normal plot. Alternatively, the k84 value can be
calculated from one standard deviation less than the median of the log(k)
values.
as taken off the log-normal plot. Alternatively, the k84 value can be
calculated from one standard deviation less than the median of the log(k)
values.
Recovery also requires the mobility ratio, ![]() for gas displacing oil, or
for gas displacing oil, or ![]() for
water displacing oil.
for
water displacing oil.
Gas viscosity is at least an order of magnitude higher than oil, mobility is greater than 1 and gas will finger through the oil phase. This is an example of an unfavorable mobility ratio. Water displacing a light oil result in a low mobility ratio, or favorable displacement. A high mobility means a high velocity, so high velocity/ low velocity results in fingering and poor recovery. Also remember ING:/ED, displacing / displaced phase. Or if you must, remember fat Ingrid on top of Ed at least for gas displacement.
Ok. I can estimate waterflood recovery using M, V, Sw, and WOR. Plots of a wide range of WOR are provided in References 1 and 2.
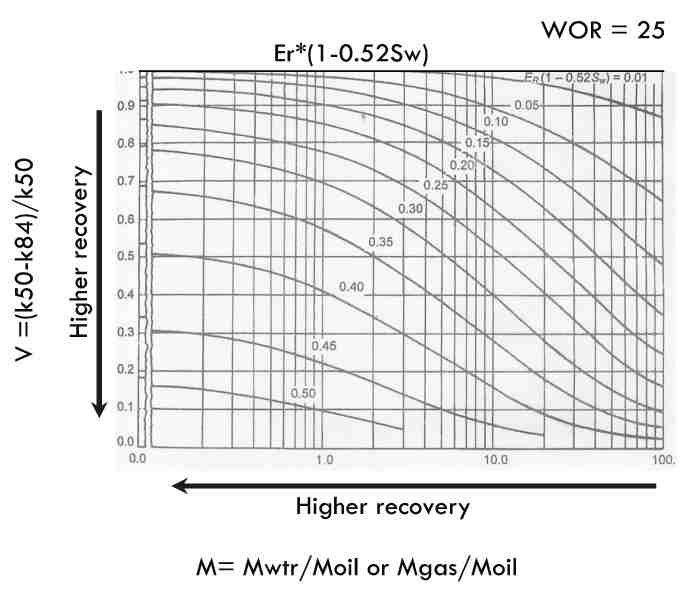 |
So, let say we have an oil with viscosity of 0.5 cp (pretty average), we'll assume that the ratio of krw/kro endpoints is 0.3, and water viscosity = 1, so M is 0.3/0.5 or 0.6. If V = 0.8, the value off the graph is 0.25. A value of Sw = 10 to 30% is only going to slightly increase so a 22- 24% recovery factor is calculated for waterflooding. Pretty reasonable.
Monitoring/ forecasting waterflood performance
Remember I had nothing good to say about use of "classical methods" for waterflood predictions prior to implementation as I much preferred simulation models. However, post implementation is a different story. All waterfloods will deviate from simulated results.
Bubble maps of injectors are excellent visualization tools. Given thickness, moveable oil saturation (1-Swc-Sorw) and porosity, the ideal swept zone from the injector can be identified.
In a depleted field, there is a period of fill-up or resaturation of the gas phase. Careful adjustments to the injectors can optimize this process. Ideally, injected reservoir volumes of water should equal the total voidage by producing wells.
Plots useful for forecasting waterflood performance include the X plot (Reference 1)
- Plotting Er vs X, where
- Plotting log(WOR) vs. Cumulative Recovery "cum-cut plot"
- Oil rate with an exponential decline with time
- Oil rate verses cumulative recovery.
Sophisticated tools:
Surveillance and field visualization tools help engineers identify trends and potential wells needing workovers. Software packages display an abundance of information related to the well history for better decision making. Certainly, the anticipated production from streamtube, simulation or decline curves can be compared with actual production, to cull out wells needing attention. Fence diagrams coupled with geological interpretations are invaluable in understanding waterflood behavoirs.
More practical information can be found in SPE Monogram 11, entitled The Design Engineering Aspects of Waterflooding, by Rose, Buchwalter and Woodhall.
References:
1. Lake, L.W., Petroleum Engineering Handbook, Vol V(B), . Reservoir Engineering and Petrophysics, H.R. Warner, V-1037, 2007
2. Craig, F.F. The Reservoir Engineering Aspects of Waterflooding, SPE Monogram 3, 1971.