Movements of fluids in porous media are govern by three forces: viscous, capillary and gravitational. These forces depend on the properties of the porous media and fluids.
At a microscopic level, fluids pass through irregular expanding and confining pathways. It would be a daunting task to calculate the frictional losses and compressional effects through the media at this level. Fortunately, on a lab scale to the field scale, Darcy's empirical equation holds and greatly simplifies the analysis. The single phase Darcy equation for steady state conditions is:
![]()
where q is in units of STB/D and A is in units of square feet. Darcy's equation is a part of many of the flow analysis done by petroleum engineers. Some of the areas where Darcy's equation plays a role are:
- Well test analysis
- Core flooding
- Fractional flow equation identifying displacement efficiencies
- Reservoir simulation
It is not used volumetic analysis and classical material balance equations. Some of the newer material balance programs have added a deliverability equation, which relates to Darcy's equation. The radial form of Darcy Law will be reviewed in a separate section.
More General Form as used in Reservoir Simulation
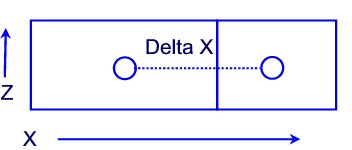
Darcy's empirical equation as used in formulation of simulation inter cell flow coefficients. The oil phase equation excluding gravity effects, is:
The same equation can be written for water and gas phases in the reservoir.
The Darcy equation can also be stated as:
where the subscript "p" stands for phase (oil, water and gas).
Note that the relevant cross sectional area for flow in the x-direction
is :![]() . The
transmissibilities, calculated at initialization for all cells, should
include
. The
transmissibilities, calculated at initialization for all cells, should
include ![]() as shown below:
as shown below:
 |
|
The term  is a dynamic property and must be evaluated in every time step. Viscosity
and Bo are calcuated based on pore volume-weighted average of the adjacent
cell. Relative permeability is calculated based on the upstream saturation.
If the two cells are at the same level, then the upstream cell is simply
the cell with higher pressure. However, if the cells are at different
levels, and have the same pressure, the cell that has the higher elevation
has a higher potential. Darcy's equation can be written to include the
gravity term as follow:
is a dynamic property and must be evaluated in every time step. Viscosity
and Bo are calcuated based on pore volume-weighted average of the adjacent
cell. Relative permeability is calculated based on the upstream saturation.
If the two cells are at the same level, then the upstream cell is simply
the cell with higher pressure. However, if the cells are at different
levels, and have the same pressure, the cell that has the higher elevation
has a higher potential. Darcy's equation can be written to include the
gravity term as follow:
Simulation also includes the continuity equation, which is beyond the discussion, at least at this point.
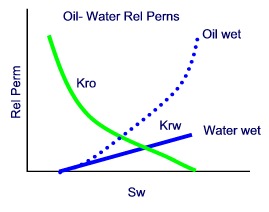
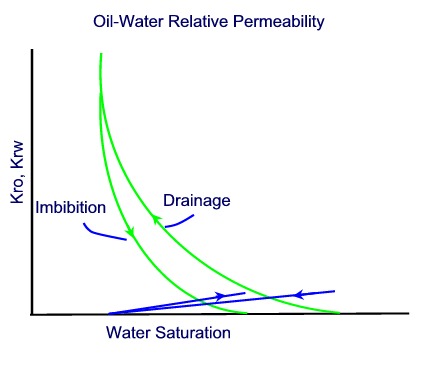
Oil-Water Relative Permeability
Relative permeability is typically measured in the laboratory. A wetting phase is the phase that has higher surface tension than the other phases, so it spreads more over the internal pore surfaces. Natural formations are thought to be water wet, however due to oil migration, they can become oil wet. The differences are shown below. In general, a water-wet system will produce at a lower water cut, thus have a higher recovery, if all other factors are the same. Relative permeability to water equals zero at the maximum water saturation, Swr, which is equal to 1-Sor, or 1-Sorw (residual oil saturation to water).
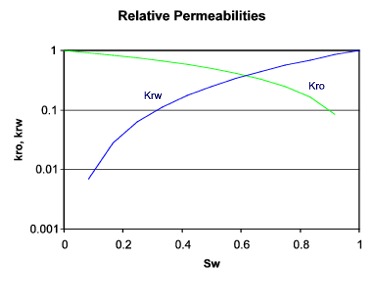
Relative permeability curves may be plotted on semi-log paper (log scale on relative permeability scale) for easier comparisons between corefloods.
Relative permeability curves may be plotted on semi-log paper (log scale on relative permeability scale) for easier comparisons between corefloods and extension of laboratory relative permeability data to saturation endpoints.
- Normalized curves
From core floods, relative permeabilities are determined from the minimum water saturation where only oil can flow to the maximum water saturation where only water flows. For purposes of averaging curves from multiple tests, the curves can be plotted on a normalized water saturation scale, where the satuation is equal to:
![]()
Note that Sw,min is often referred to as the initial or connate water saturation. It is for the particular test, however due to limited coring, connate water is typically estimated from logs.
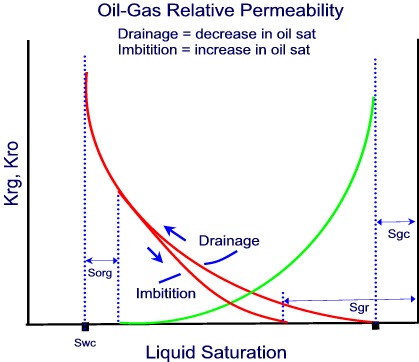
Gas-Oil Relative Permeability
Gas-Oil relative permeability curves can be plotted verses total liquid saturation or gas saturation.
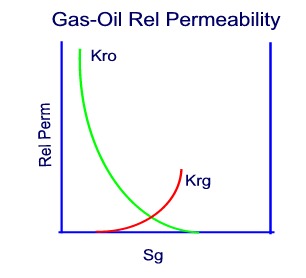
When relative permeabilities are determined from core floods, values of Kro and Krg will be determined over a range of gas saturations (Sg, min to Sg, max) where there is two phase flow. The maximum gas saturation is related to the residual oil saturation to gas as follows:
For simulation, the gas-oil curves must be extended to relative permeability = 1, as follows:
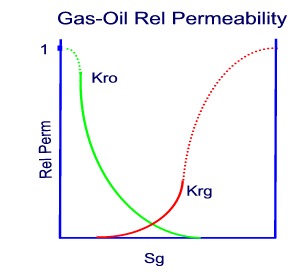
Plotting the relative permeabilities on a semilog scale may improve the extrapolation of the curves.
Hysteresis Effects on Capillary Pressure and Relative Permeability
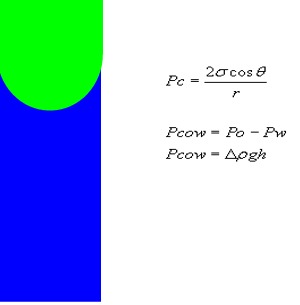
Capillary pressure is the difference in pressure between the non-wetting
phase and wetting phase, or Pcap = Pnw - Pw. Gas or air are never wetting
phases. For oil-water system, water is assumed to be the wetting phase,
so the oil-water capillary pressure is![]() .
Similarly, the gas-oil capillary pressure is:
.
Similarly, the gas-oil capillary pressure is:![]() .
.
|
|
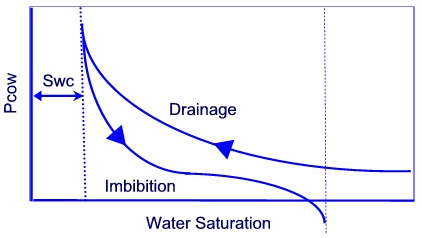
Capillary pressure is typically seen as a force that pulls a fluid upwards, such as absorbing fluid in a towel. As shown on the right, the water rises in a capillary tube. At the oil-water interface, the oil pressure equals the water pressure plus the capillary pressure. The porous media can be idealized as a bundle of capillary tubes. Under this analogy, capillary pressure is a function of saturation for a particular oil-water or gas-oil system. Capillary pressure is also a function of the direction in which saturation is changing. This phenomena, called hysteresis, means to correctly know the capillary pressure, we must know the history of saturation changes. There are two cases: Drainage: Flow resulting from a decrease in the wetting phase. Imbibition: Flow resulting from an increase in the wetting phase. The effect of hysteresis on oil-water capillary pressure is shown on the left. Typically, the drainage curve is used in simulation. This may seem incorrect as typically water entrusion (or water flooding) would increase Sw with time. However, capillary pressures are used to assign the correct initial water saturations within the reservoir. As the formation is "filled", oil displaces water, decreasing the wetting phase (water).
|
|
Coming topics: More discussion of Capillary Pressure and Transition Zone height and 3-Phase Rel Perms.
References
1. Craft, B., Hawkins, M. and Terry, R., Applied Petroleum Reservoir Engineering, 1991.
2. Dake, L.P., Fundementals of Reservoir Engineering, 1978.
3. Core Laboratories, Special Core Analysis, 1977.