Traditional Decline Curve Analysis
|
Exponential, harmonic
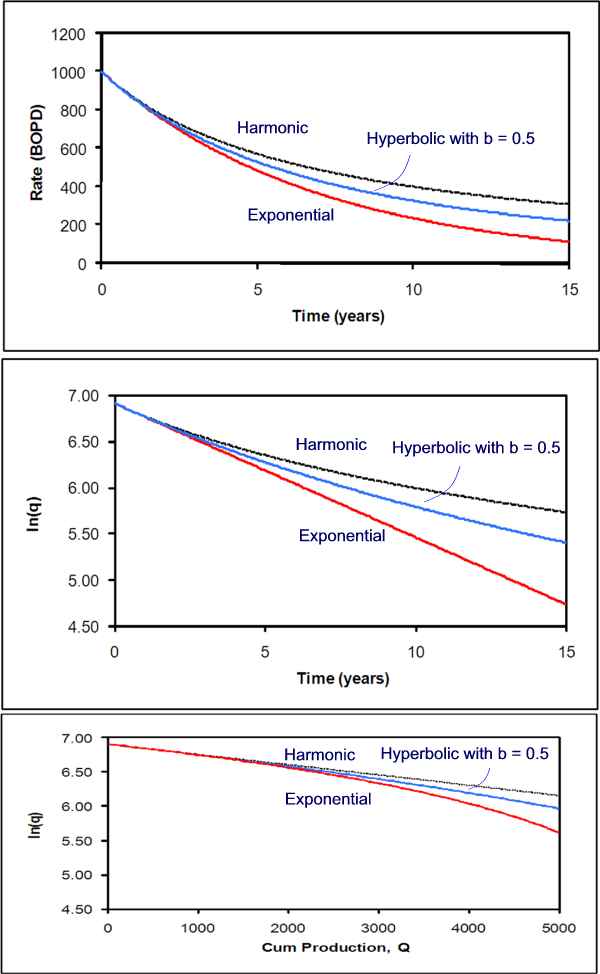
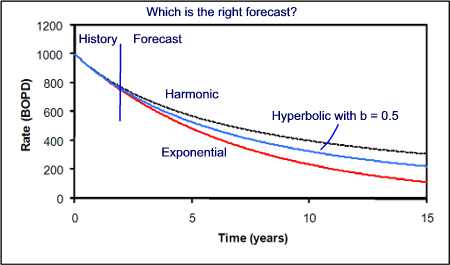
or hyperbolic decline? The days of plotting rates on semi-log graph paper are long gone. In the industry, commercial software programs are used with extensive database capabilities to quickly develop forecasts. In general, the exponential decline is the most commonly used method. Perhaps in the beginning, it was as matter of convenience. Today, with everyone using software generated decline curves, all methods are equally convenient. The graph below shows all three decline equations fit nearly exactly to the first 2 years, and produce noticeably different forecasts. If all three decline equations match the historical data, then the exponential decline forecast will show the most decline in rates, hence provide the most conservative forecast.
Conservative forecasts are probably most appropriate in the early stages of production where there are more unquantifiable factors that tend to reduce the field rate rather than increase them in the future. This includes down time related to facility and well maintenance. Secondly, if the decline curve analysis is to be used for reserves calculations, the forecast needs reflect a "reasonable certainty" standard. The hyperbolic curve requires estimation of both Di and the exponent "b." Hyperbolic decline curves have been used in many cases, particularly in the late history of pressure supported production. Finally, the cumulative recovery should result in a reasonable recovery factor, based on volumetrics. Very good suggestions on reconciliation of estimates (simulation, material balance, and decline curve analyses) are provided in reference 2, page V-1531. Most computer programs allow multiple forecasts to be made, and sensitivity analysis on the computed variables. If the objective of the forecast is an upside projection, useful in facility design, then harmonic and hyperbolic methods may be employed. Also, note that the rate, BOPD, can be MSCF gas. In fields under pump and producing high volumes of water, then a linear relationship between log of water cut and Np would reflect harmonic decline. Linear relationship between water cut and Np would suggest a exponential decline.
|
Notation:
qi = Initial rate, q(t) = rate at time t, Q(t) = Cumulative Production, Di = decline rate, b = used in hyperbolic decline, b = 1 for harmonic. Keep units consistent. Decline rate is not annual decline, but used as a parameter in the equation.